This is the most complete financial model in our calculator suite — it combines construction financing, rental income, operating expenses, and property appreciation into a single 30-year projection, then distills it into the return metrics real estate investors actually use: cash-on-cash return, cap rate, IRR, equity multiple, and more.
In this guide:
- How to Use This Calculator
- Understanding Your Results
- The ROI Metrics, Explained
- Where the Defaults Come From
- Assumptions & Limitations
How to Use This Calculator
The form is organized into four groups; work through them top to bottom:
- Property Information — your home's current market value and an appreciation rate (the same historical presets as the Equity Growth Calculator). These drive the equity-growth section of the results.
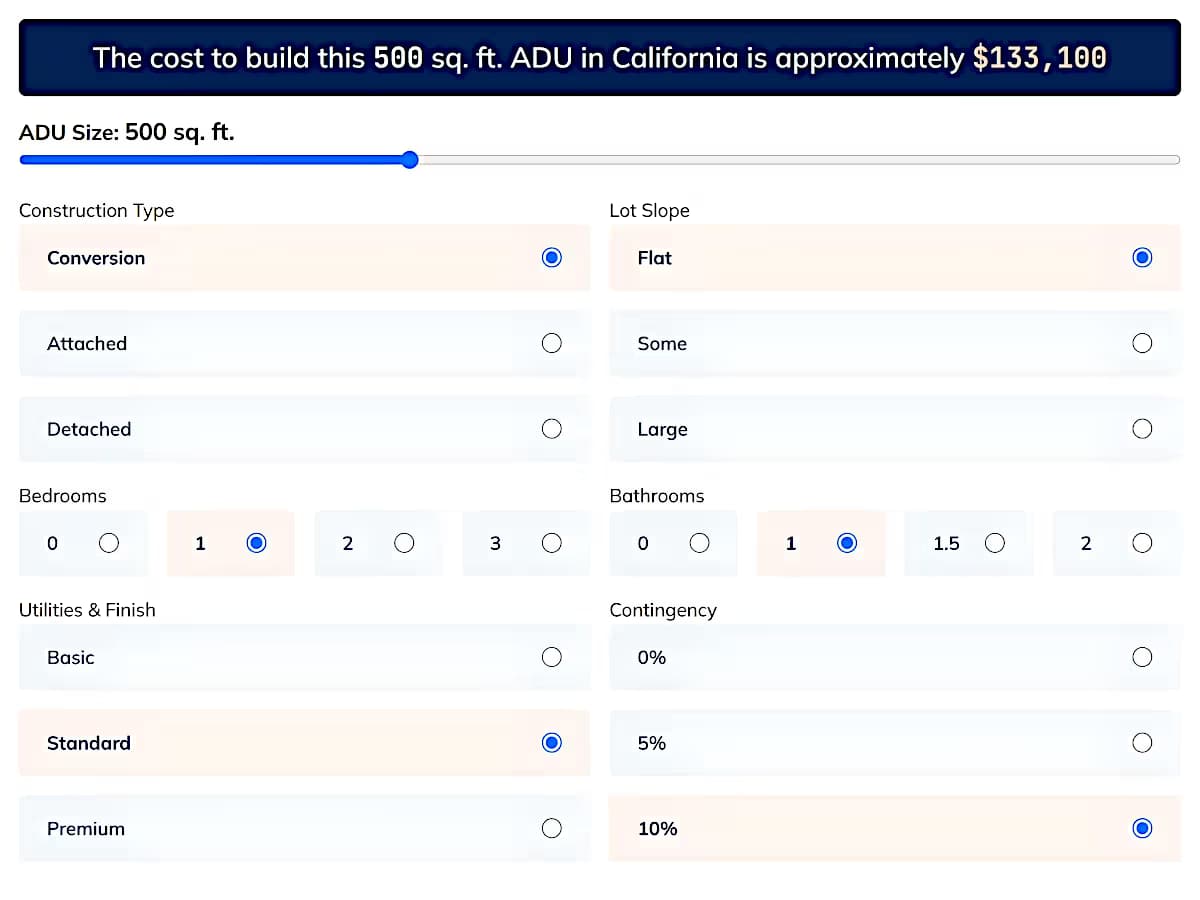
- Construction Financing — project cost, downpayment percentage, interest rate, and loan term. Your downpayment is the "cash invested" that all the return metrics measure against.
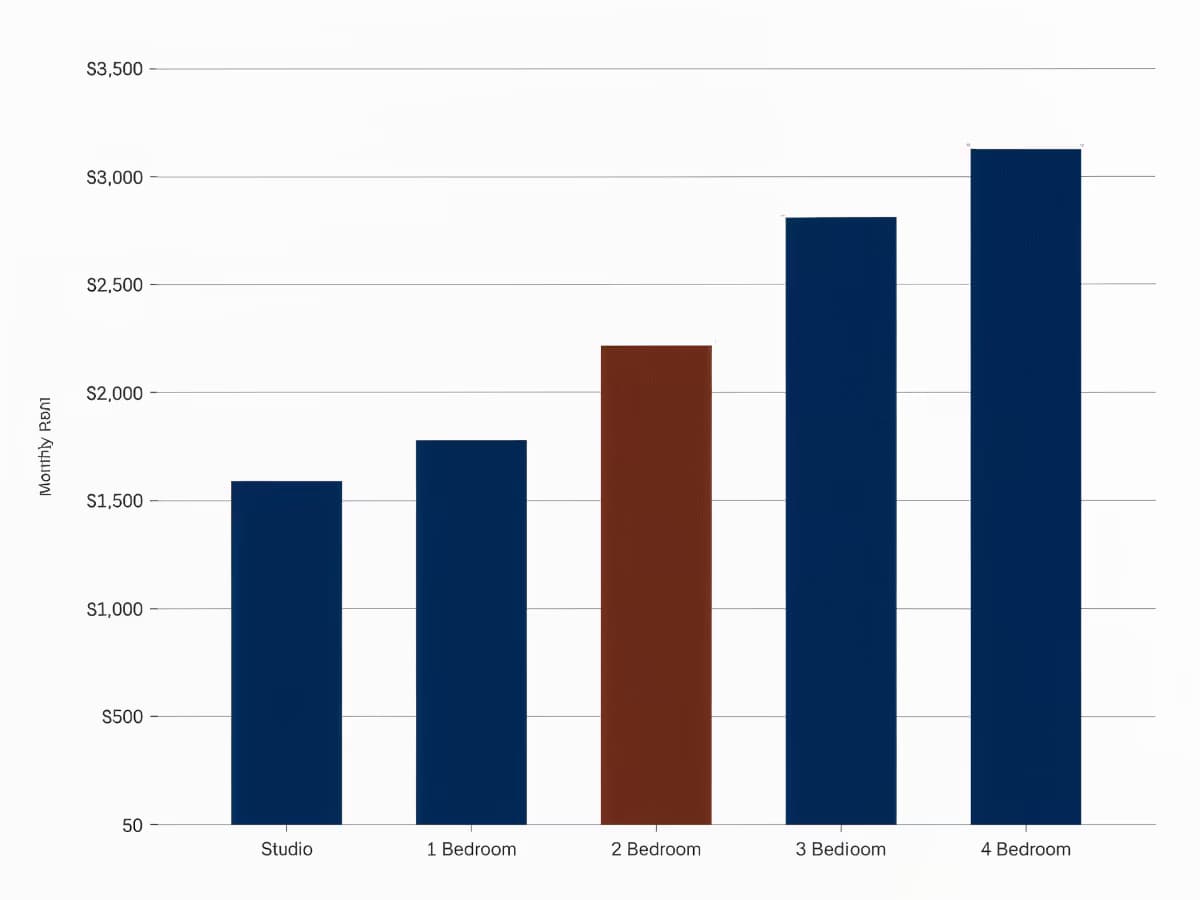
- Rental Cash Flow — expected monthly rent (the Rental Income Estimator provides a data-backed number for your ZIP), a vacancy allowance, and an annual rent growth rate.
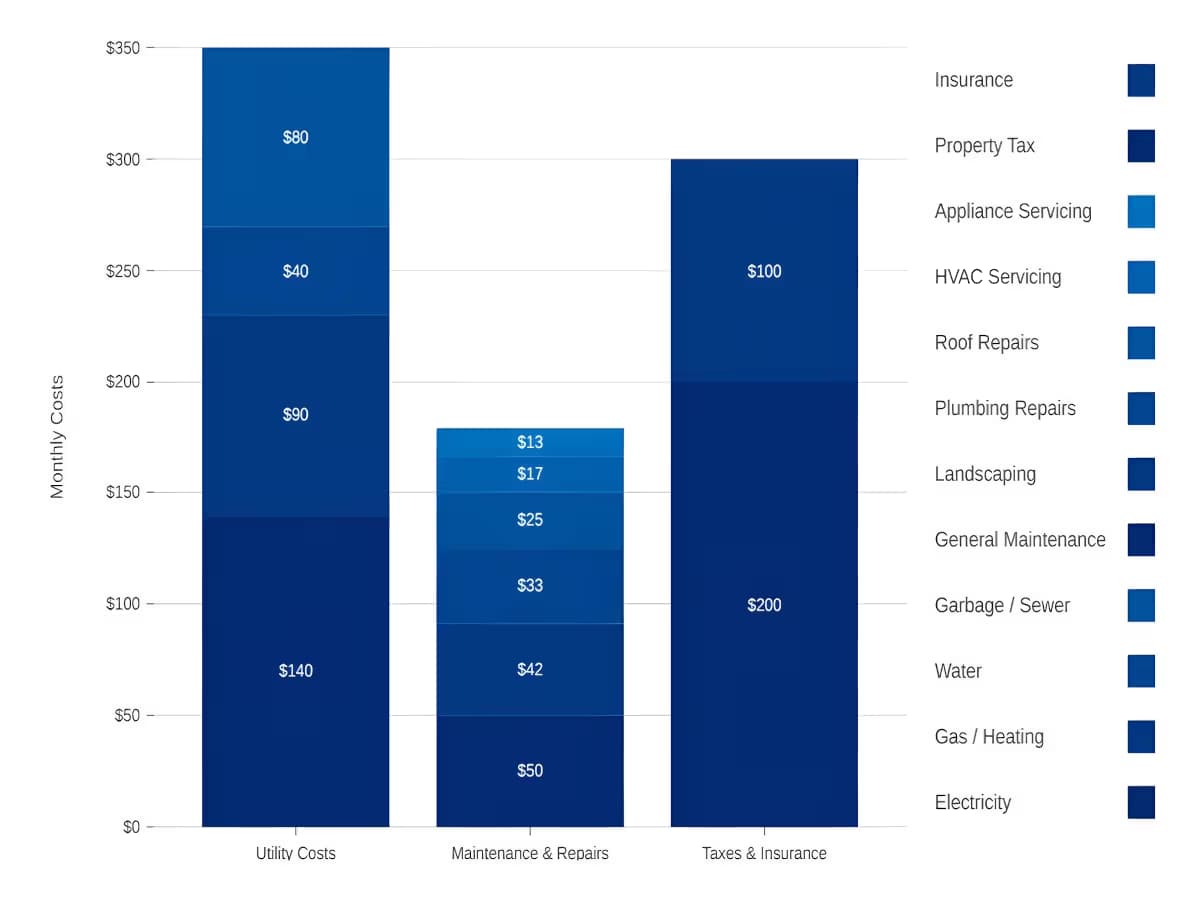
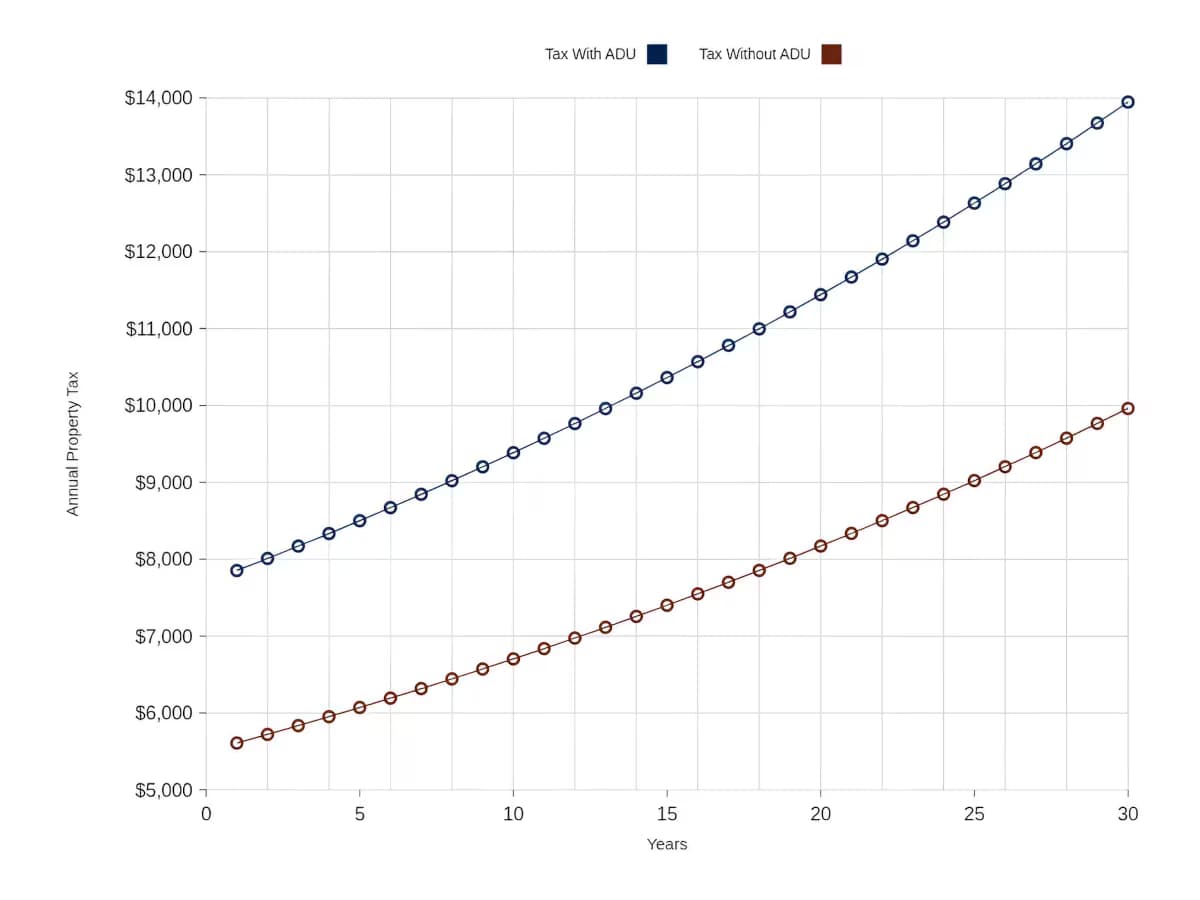
- Expenses, Tax & Insurance (annual) — operating costs. The Utility & Maintenance Cost Calculator produces the first field; property tax and insurance are the ADU increments, not your whole-property bills.
Understanding Your Results
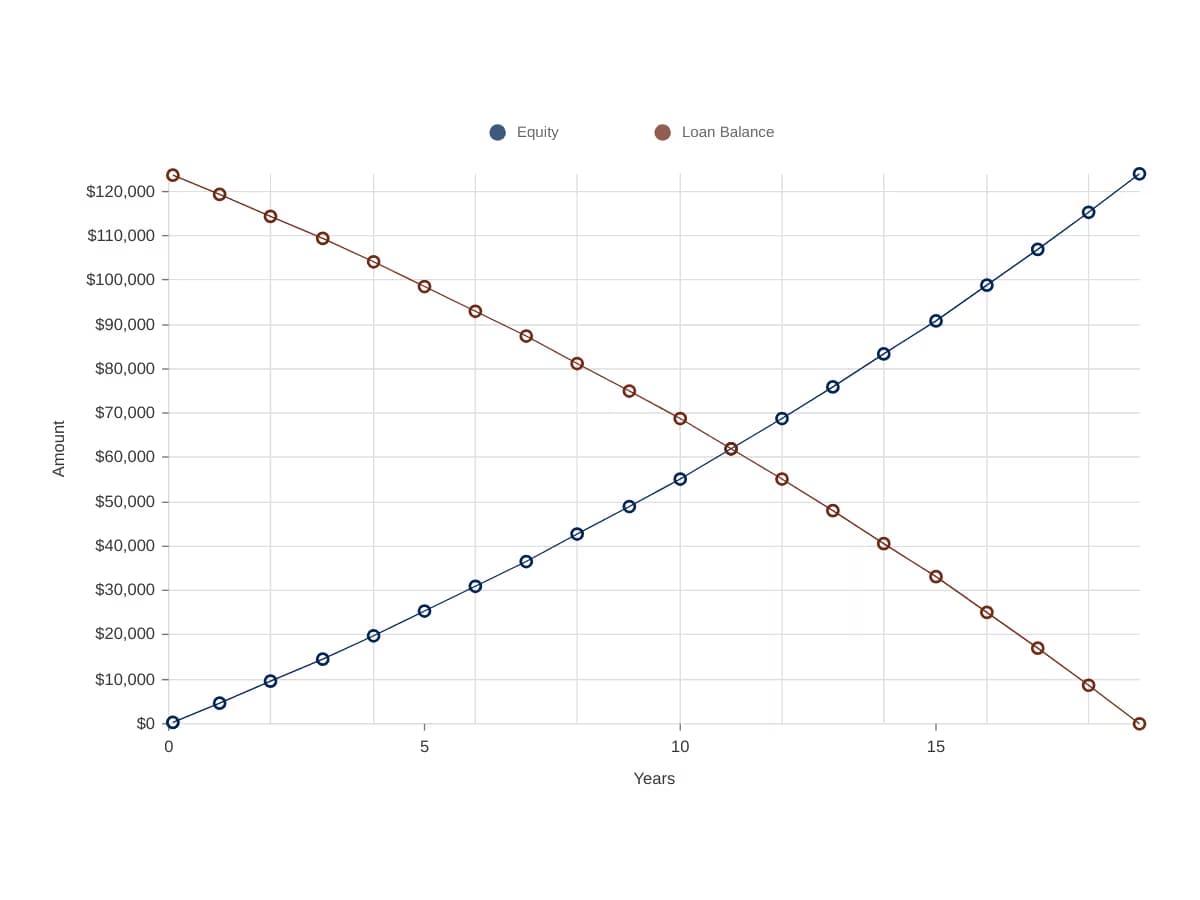
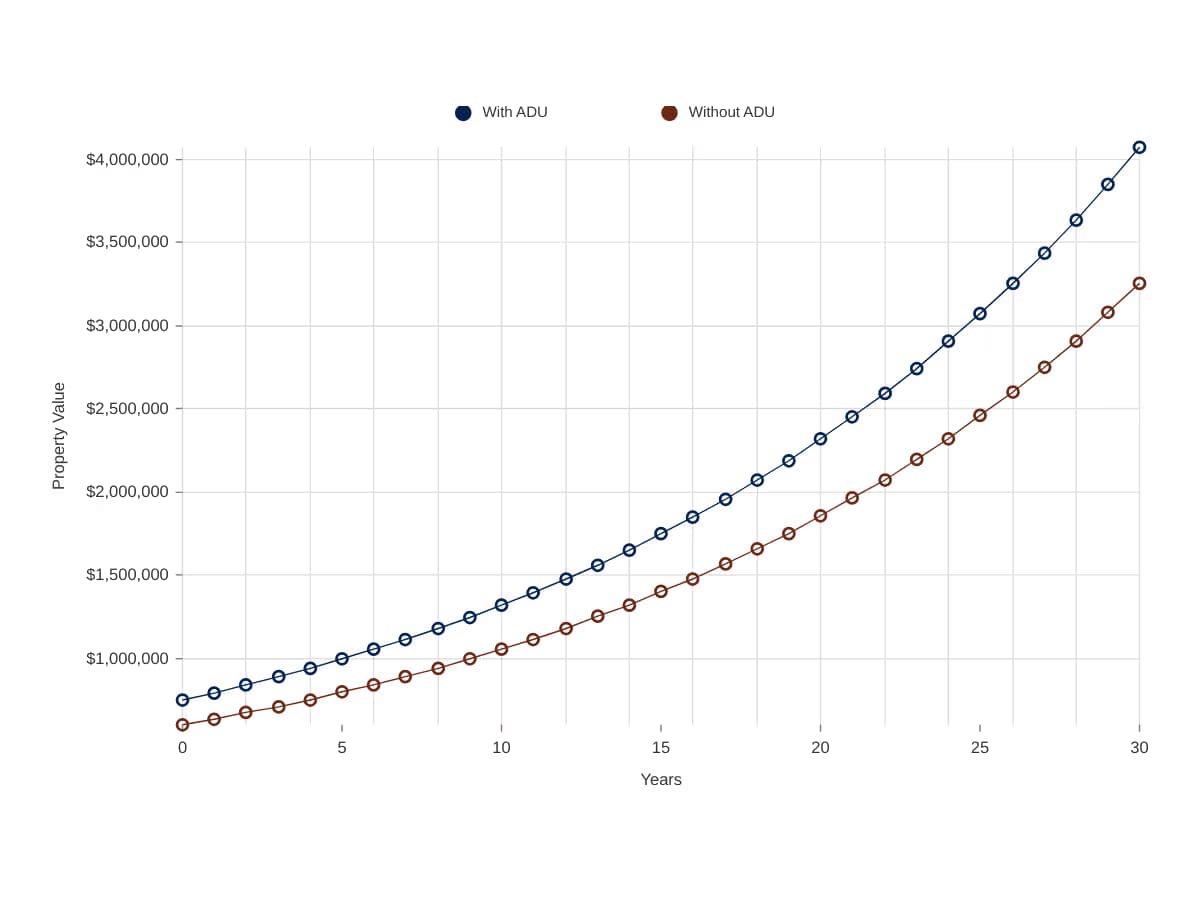
The analysis reads as a story in five acts. Equity Growth shows the immediate value bump from adding an ADU (a conservative 25% of your property value) and how the extra equity compounds over 10, 20, and 30 years. Financing Details summarizes the loan: amount financed, monthly payment, and lifetime interest.
The next two panels walk the first year's income waterfall explicitly: rent × 12 = gross annual rent, minus vacancy loss = effective gross income, minus operating expenses = net operating income (NOI), minus annual debt service = annual cash flow before tax. If that last figure is negative, the ADU costs you money each month in year one — common with high leverage, and not automatically a bad deal if rent growth or equity gains make up for it later.
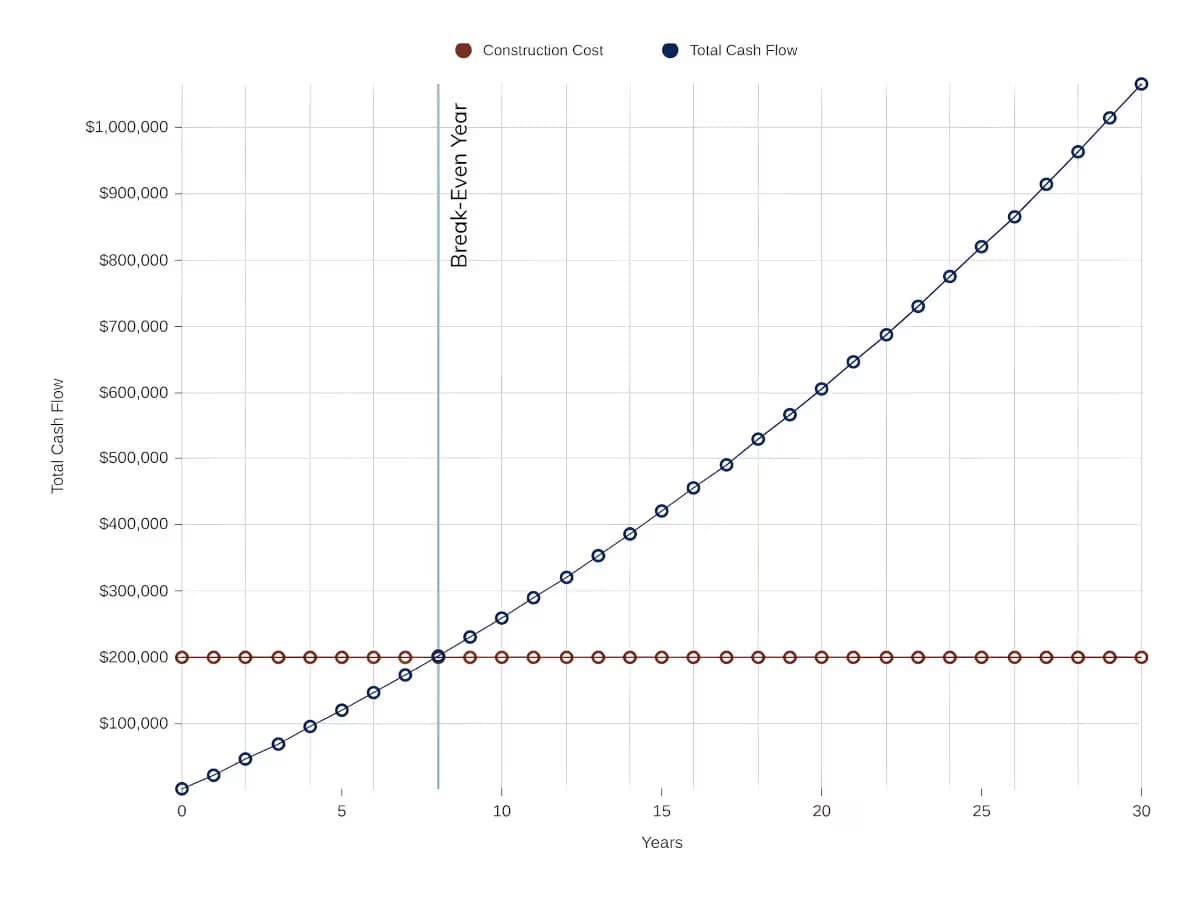
The chart shows three lines over 30 years — effective gross income, NOI, and cash flow before tax — that fan out as rent compounds. The collapsible month-by-month table below shows every payment and running totals, with the leveraged break-even month (when cumulative cash flow exceeds the financed amount) highlighted.
The ROI Metrics, Explained
Each card answers one specific question about the deal:
| Metric | The Question It Answers |
|---|---|
| Cash-on-Cash Return | In year one, what percent of my out-of-pocket cash (the downpayment) comes back as cash flow? Rental investors often look for mid-single digits or better. |
| Capitalization Rate | What percent of the property's (post-ADU) value does the first year's NOI represent, ignoring the loan? Useful for comparing against other properties regardless of financing. |
| Average Annual Cash Yield | Averaged across all 30 years, how much cash does each dollar of downpayment generate annually? Higher than year-one cash-on-cash because rent compounds. |
| 30-Year IRR (Cash Flow Only) | What constant annual rate of return makes the stream of monthly cash flows equivalent to your initial cash outlay? The most complete time-value measure of the cash flows themselves. |
| 30-Year Equity Multiple | For every $1 of downpayment, how many total dollars of cash flow do I collect over 30 years? A multiple of 2.0× means you doubled your cash (before considering time value). |
| Average Annual Return (CAGR) | What steady compound growth rate turns my initial cash into the 30-year total? A smoothed companion to the equity multiple. |
Note that the IRR, equity multiple, and CAGR here are cash-flow-only: they deliberately exclude the equity gains shown in the first panel. Since the equity boost alone often exceeds the downpayment, total returns (including appreciation) are typically much higher than these conservative figures.
Where the Defaults Come From
- Growth-rate presets (5.8% / 7.2% / 9.6%) — California average annual home appreciation over 2000–2020, 2010–2020, and 2024 respectively; the 20-year average is the default because it spans a full boom-and-bust cycle.
- 6.5% interest, 20% down, 30-year term — the ballpark of recent fixed home-equity lending; see the Financing Calculator article for how different loan products change this.
- 7.7% vacancy — approximately the long-run national average rental vacancy rate; California markets typically run tighter, so this errs on the conservative side.
- 3.5% rent growth and 3.5% expense growth — near California's long-run averages for both, keeping margins stable in the default scenario.
- 25% instant equity boost — the conservative middle of the 20–35% value uplift observed for California homes that add an ADU.
Assumptions & Limitations
All results are pre-tax: the model excludes income tax on rent, depreciation deductions, and capital-gains implications — factors that often improve after-tax returns and are worth discussing with a tax professional. It also assumes the loan runs its full term with no refinancing or early payoff, rent starts at completion with no lease-up gap, and expense categories grow at a single shared rate. Treat the output as a planning framework for comparing scenarios, not a guarantee of returns.