A well-priced California ADU rental typically pays back its construction cost in 7 to 12 years — sometimes faster in high-rent areas. This calculator projects your ADU's cumulative rental cash flow month by month and finds the break-even point: the moment total cash flow catches up with what you spent to build. It deliberately ignores loans and interest so you can see the property's underlying economics first.
In this guide:
- How to Use This Calculator
- Understanding Your Results
- Where the Default Rates Come From
- Why Financing Is Left Out
- Assumptions & Limitations
How to Use This Calculator
| Field | What to Enter |
|---|---|
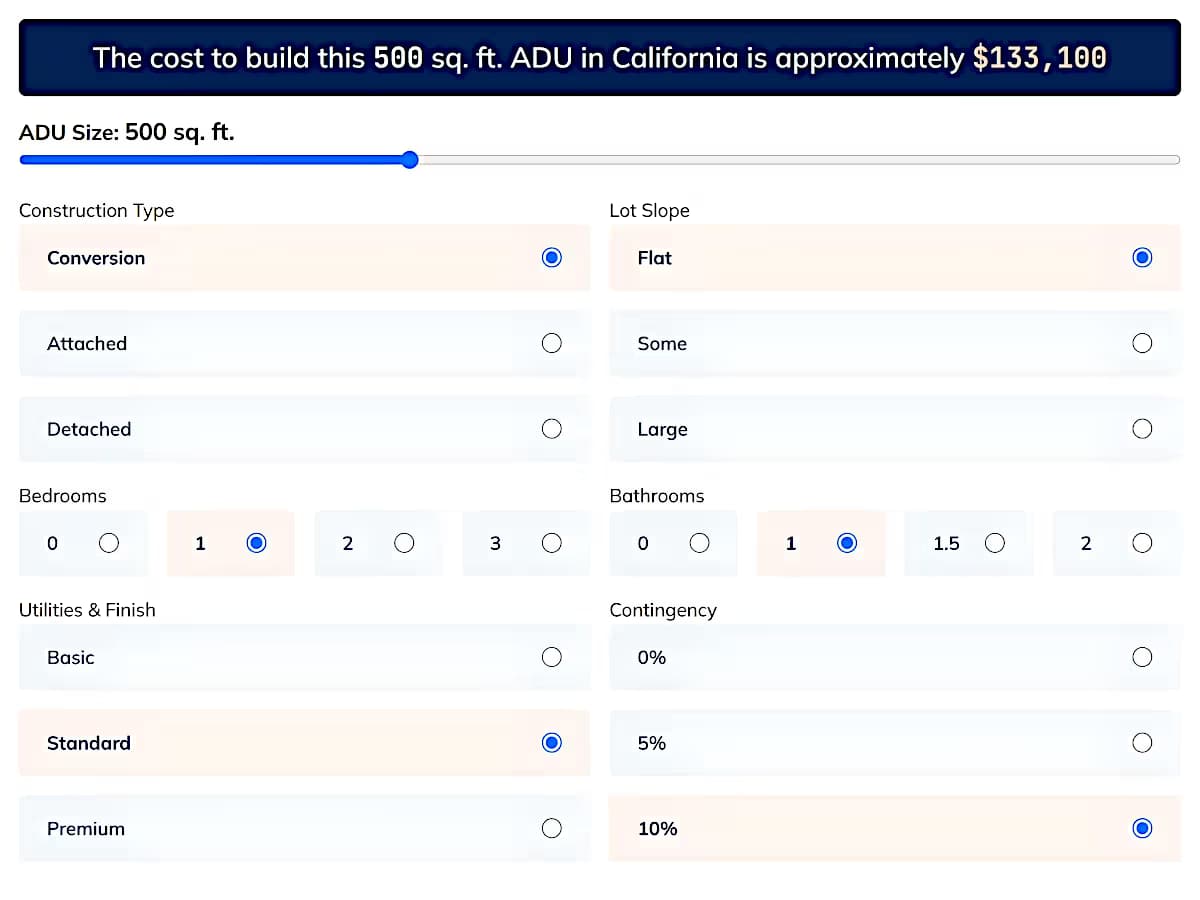
| Construction Cost | Your all-in project budget — the amount that cash flow must recoup. Estimate it with the Construction Cost Calculator if you don't have a quote. |
| Monthly Rent | Realistic market rent for the finished unit. The Rental Income Estimator gives a data-backed figure for your ZIP code and unit size. |
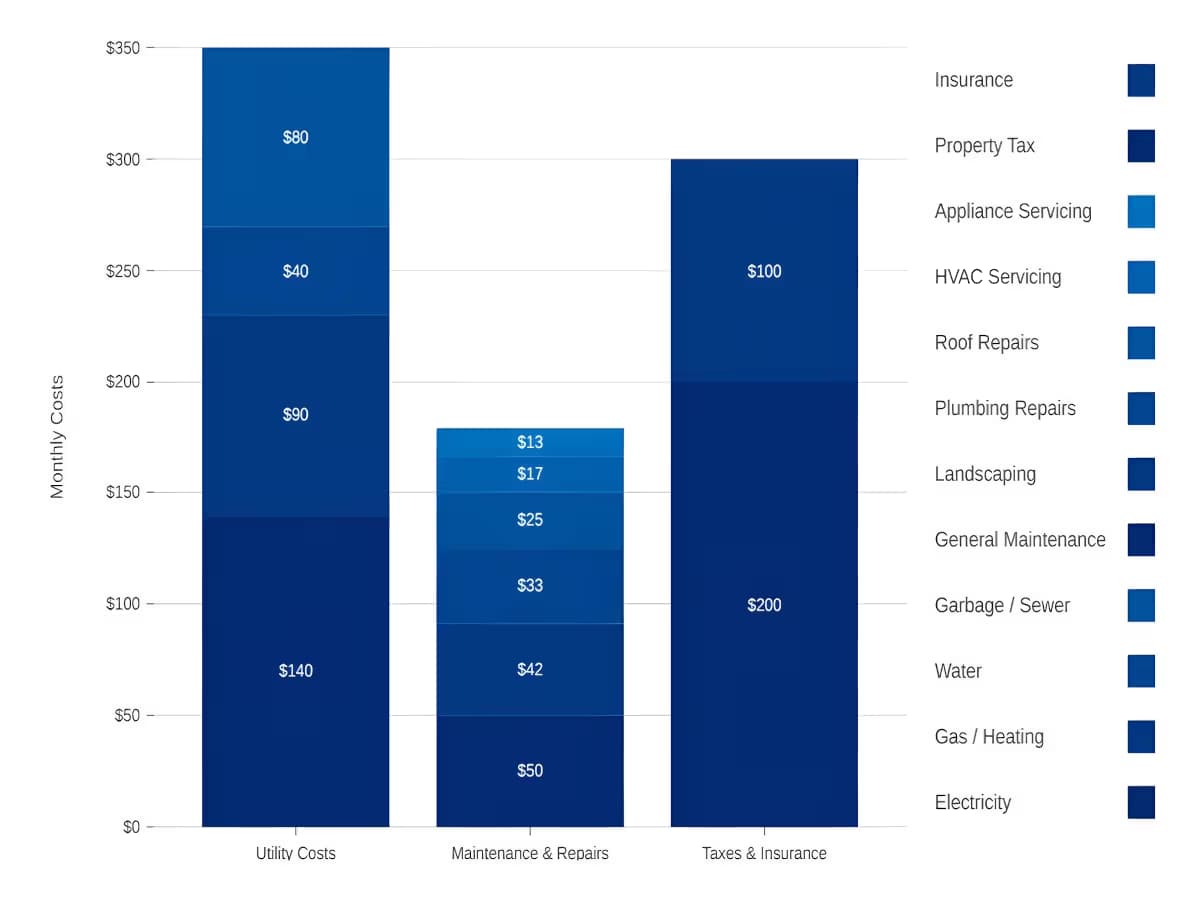
| Monthly Expenses | Recurring ownership costs — utilities, maintenance reserves, taxes, insurance. The Utility & Maintenance Cost Calculator produces exactly this number. |
| Annual Vacancy Rate | The share of the year you expect the unit to sit empty between tenants (default 7.7% ≈ 4 weeks). |
| Annual Rent Increase / Expense Inflation | How fast rent (default 3%) and expenses (default 3.5%) grow each year. Both are applied once per year, at the start of each new lease year. |
Understanding Your Results
The Break-Even Analysis panel leads with the headline number — for example, "7 years, 11 months" — alongside the 30-year totals for cash flow and profit (total cash flow minus construction cost). If rent never catches up with costs, it will say so instead.
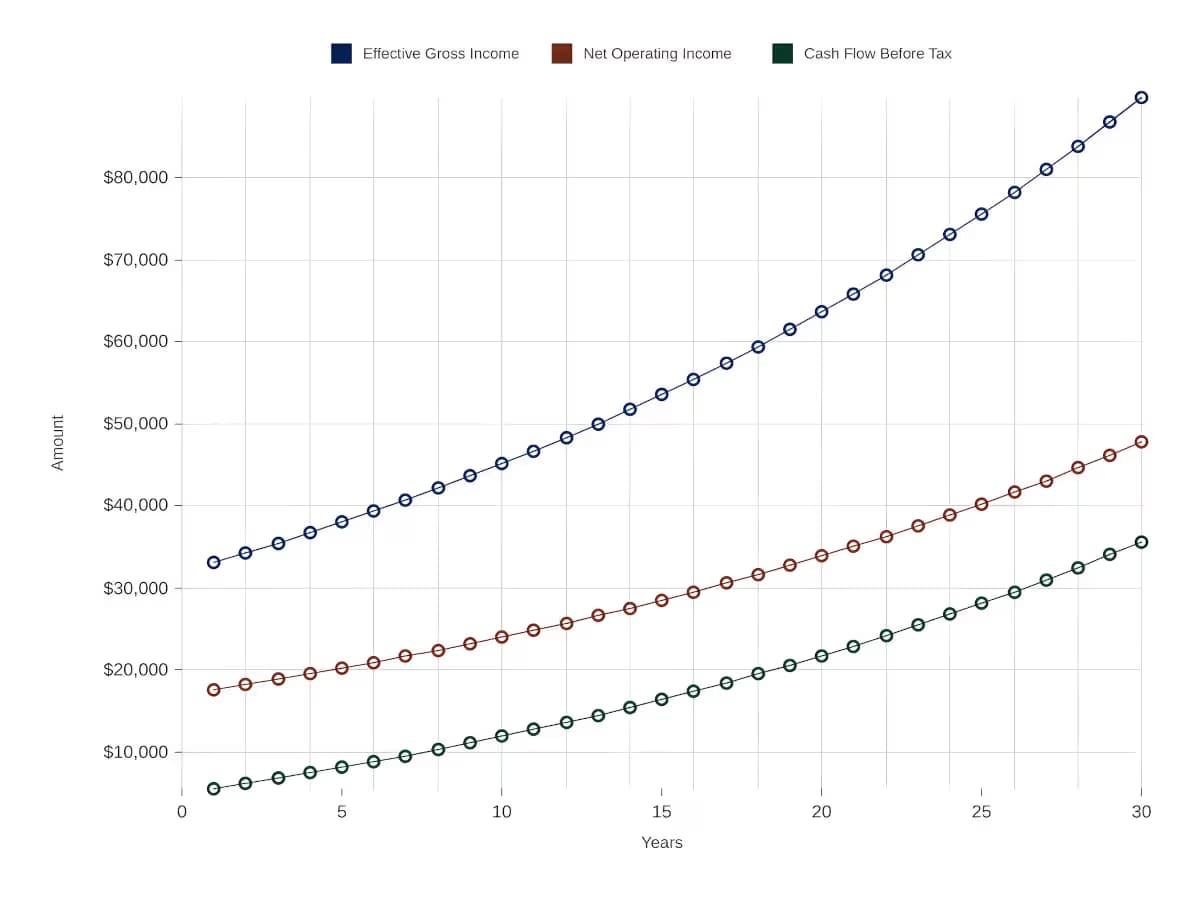
The chart makes the mechanics visible: a flat line for your construction cost, and a rising curve of cumulative cash flow. Where they cross is your break-even year, marked with a vertical line. The cash-flow curve bends slightly upward over time because rent compounds — later years contribute more than earlier ones.
The collapsible Month-by-Month Financial Breakdown shows every month's rent (after vacancy), expenses, cash flow, and running totals, grouped by year, with the break-even month highlighted in green. Download it as a CSV to adjust assumptions in your own spreadsheet.
Where the Default Rates Come From
- 7.7% vacancy — roughly the long-run U.S. average rental vacancy rate reported by the Census Bureau, equivalent to about four weeks empty per year. California's rental markets typically run tighter than the national average, so this default is conservative; in high-demand coastal metros, 3–5% may be closer to reality.
- 3% annual rent increase — in line with California's long-run average rent growth. Note that AB 1482 caps annual increases at 5% plus local CPI (10% maximum) for covered units, so sustained increases far above this default aren't always legally available; many single-family/ADU situations are exempt, but check your case.
- 3.5% expense inflation — slightly above general long-run CPI, reflecting that insurance, utilities, and trade labor in California have recently outpaced headline inflation.
Because expenses are assumed to grow faster than rent by default, the monthly margin slowly narrows in percentage terms — a deliberately cautious posture. Set the two rates equal to model a neutral scenario.
Why Financing Is Left Out
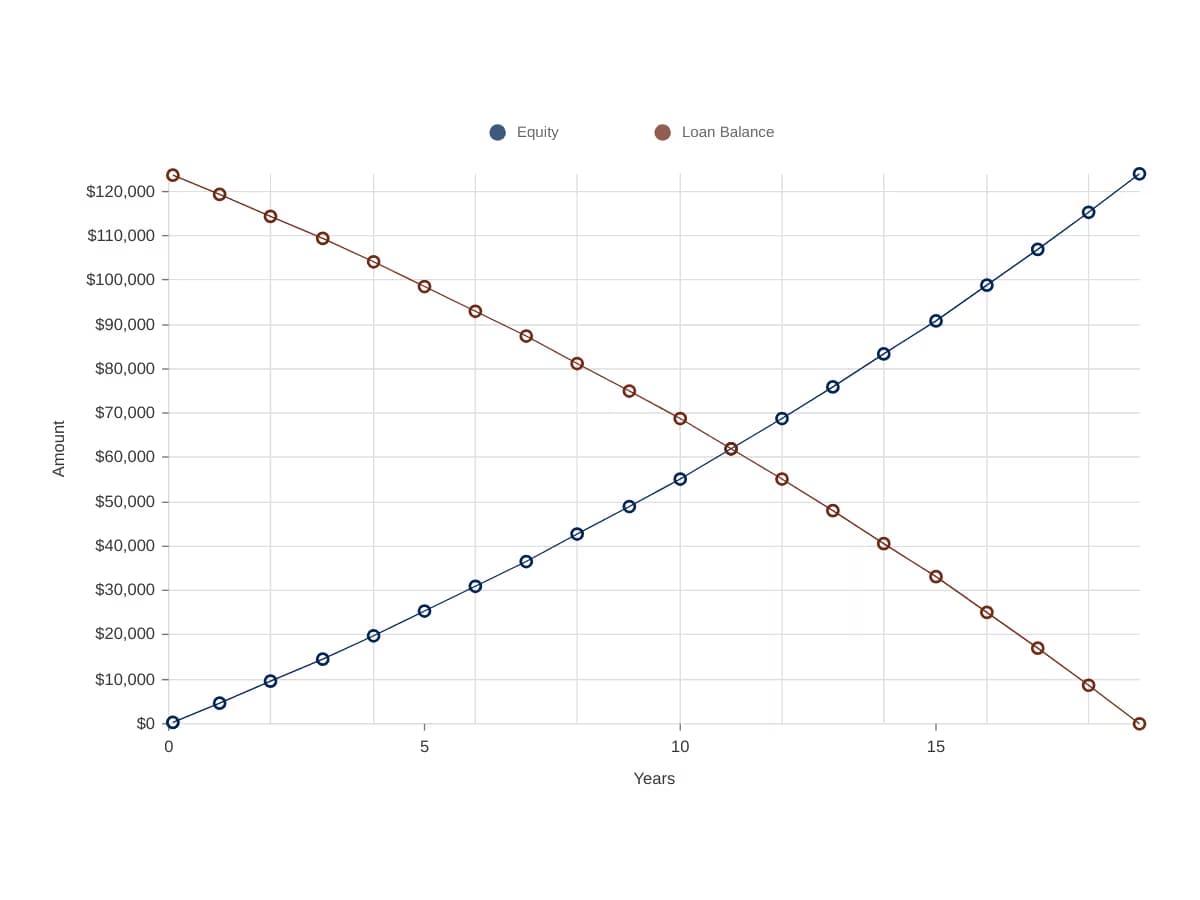
This tool intentionally models a cash purchase. Separating the property's economics from the loan's economics answers a cleaner question — is this a good project? — before the follow-up, is this a good loan? A project that breaks even in 8 years on its own merits can look dramatically different (better or worse) once leverage is added.
When you're ready to layer in a loan, the Cash Flow & ROI Calculator combines this calculator's rental model with mortgage payments and reports leveraged metrics like cash-on-cash return and IRR.
Assumptions & Limitations
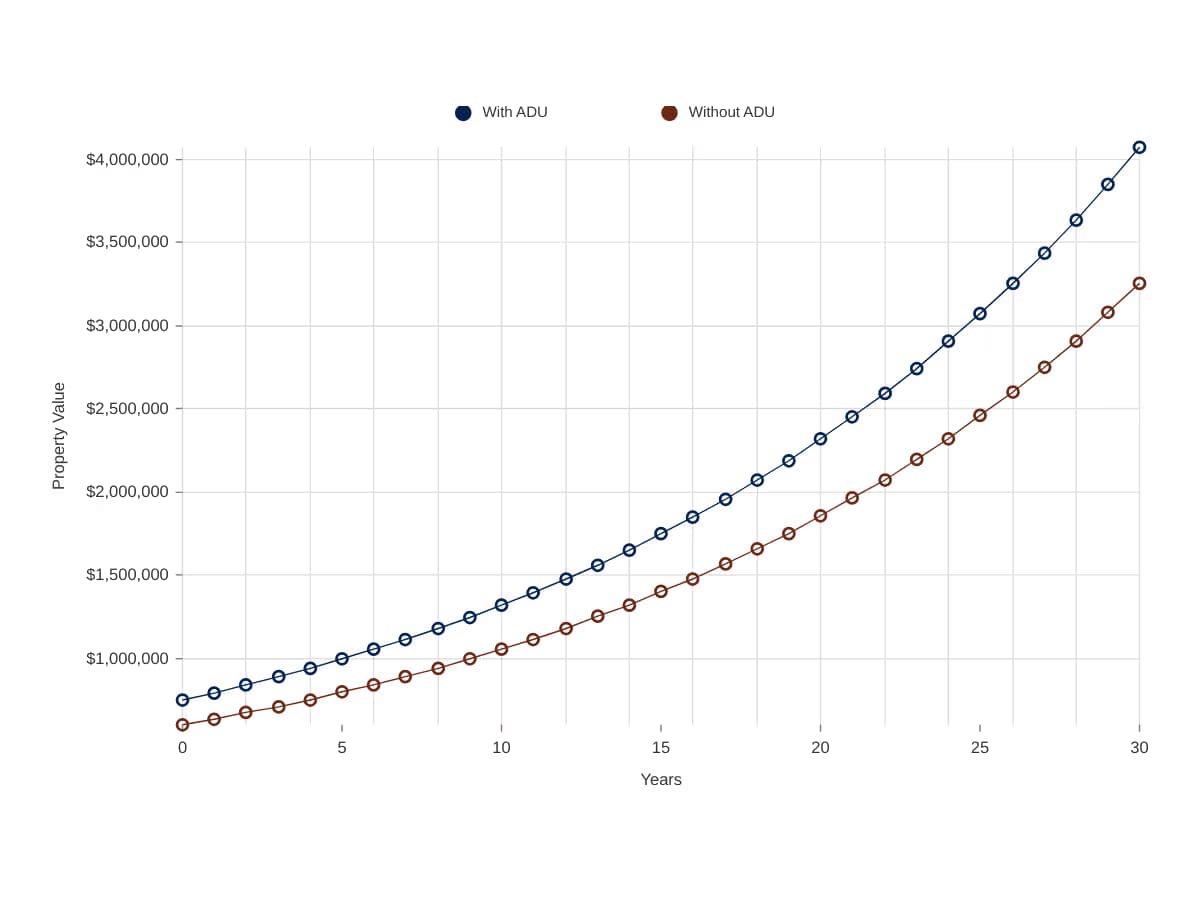
The projection assumes the unit rents at your stated price from month one, applies vacancy evenly across all months (real vacancies are lumpy—a few empty weeks between tenants), and grows rent and expenses in a single annual step. It excludes financing, income taxes, depreciation benefits, and any appreciation in the property's value — the last, often largest, component of ADU returns is covered by the Equity Growth Calculator.